
Missing boxplot endpoint
Missing boxplot endpoint
Missing boxplot endpoint · unknown endpoint,IQR,range
- 198 bytes
- COMP mode
Worked examples
Example 1
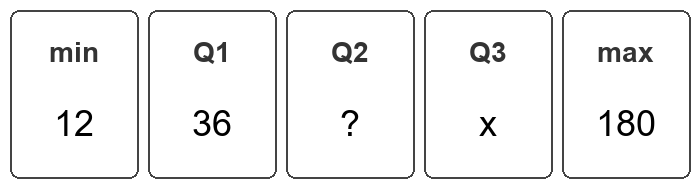
A boxplot for annual book loans has minimum 12, lower quartile Q₁=36 and maximum 180. Its full range is 3 times its interquartile range. Find the missing upper quartile Q₃.
Answer
Standard solution (without a calculator)
- Find the full range: 180−12=168 loans.
- Use the given ratio: 168=3×IQR, so IQR=168/3=56 loans.
- Recover Q₃: IQR=Q₃−Q₁ gives Q₃=36+56=92 loans.
- Check the order: 12≤36≤92≤180, so the recovered quartile fits the boxplot.
- Choose the option: Q₃=92 loans, option B.
Example 2
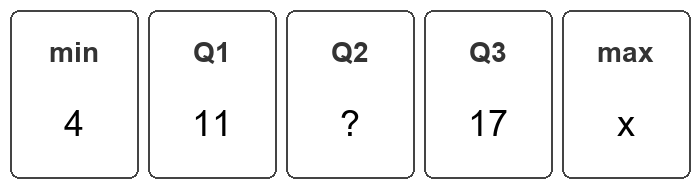
A boxplot of exercise times has minimum 4 minutes, Q₁=11 minutes and Q₃=17 minutes. Its range is 4 times its IQR. Find the missing maximum time.
Answer
Standard solution (without a calculator)
- Find IQR: Q₃−Q₁=17−11=6 minutes.
- Use the ratio: range=4×6=24 minutes.
- Recover the maximum: maximum=minimum+range=4+24=28 minutes.
- Check the order: 4≤11≤17≤28, so the endpoint is valid.
- Choose the option: The maximum is 28 minutes, option C.
Example 3
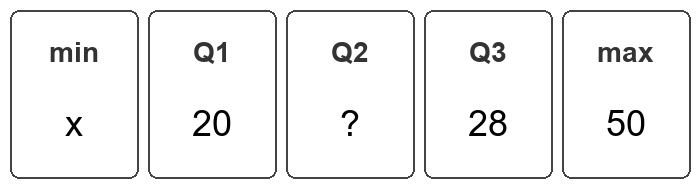
A boxplot for weekly article counts has Q₁=20, Q₃=28 and maximum 50, but its minimum is unlabelled. The full range is 4 times the IQR. Find IQR, range and minimum, and check the endpoint order.
Answer
Standard solution (without a calculator)
- Find IQR: Q₃−Q₁=28−20=8 articles.
- Use the ratio: range=4×8=32 articles.
- Recover the minimum: minimum=maximum−range=50−32=18 articles.
- Check the order: 18≤20≤28≤50, so the recovered endpoint is valid.
- State the results: IQR=8 articles, range=32 articles and minimum=18 articles.
When to use it
A boxplot’s ordered endpoints satisfy minimum≤Q₁≤Q₃≤maximum. Its interquartile range is Q₃−Q₁ and full range is maximum−minimum. If the ratio k=range/IQR is given, one missing endpoint can be recovered from the other three. The median Q₂ is not used.
Choose the missing endpoint
- Enter M=1 for missing minimum, M=2 for missing Q₁, M=3 for missing Q₃ or M=4 for missing maximum. Then enter the other three known endpoints from left to right as A, B and C, followed by positive ratio D=k.
- For example, when Q₃ is missing, A is minimum, B is Q₁ and C is maximum. Do not put the median Q₂ into A, B or C; it is not one of the four endpoint positions.
Read the recovered values
- Read the recovered endpoint X, then IQR Y, then full range D×Y. Press EXE at the first two Disp pauses and AC after the range.
- Invalid mode, k≤0, out-of-order known endpoints or a recovered endpoint outside its proper interval cause Math ERROR. A boxplot alone does not give a standard deviation.
Question types
- Original HKDSE Mathematics Compulsory Part statistics practice can combine a labelled boxplot with a stated range-to-IQR ratio. State the missing endpoint and verify its order among the known endpoints.
Before you start
- Use COMP and an empty P1 with at least 198 bytes; P1–P4 share 680 bytes. The code does not use trigonometry; the angle unit does not affect the answer.
- M must be 1, 2, 3 or 4 for minimum, Q₁, Q₃ or maximum respectively. The median Q₂ is not recoverable by these modes.
- Enter the other three endpoints as A≤B≤C and the positive ratio D=k. The program checks their order and whether the solved endpoint fits, but not whether an actual dataset could produce that boxplot.
- Use one consistent measurement unit for endpoints, IQR and range; k is dimensionless. Enter all five values explicitly. Blank EXE may retain old values and is not zero.
- The program uses or overwrites M, A, B, C, D, X and Y; save important stored values before running. A negative endpoint is allowed; use (−).
- The first screen is the missing endpoint, the second IQR and the last range. Math ERROR marks invalid input; it is not a numerical endpoint.
- Very large endpoints with small differences can lose precision. A boxplot summary does not guarantee exactly 25% of observations in each interval when values tie.
Checking access…